Updated 0s ago · Free board, delayed at least 60 s
The Kobeissi Letter @KobeissiLetter on X
The Kobeissi Letter has posted 1 time so far today, Sunday, November 22 (New York time), against a usual 8 by this hour.
- Today
- 1
- Usual by now
- 8
- Last 7 days
- 169
- Daily average
- 24.1
Below usual
Latest posts
- RepostThe Kobeissi Letter reposted

The feedback on our Article has been incredible. I founded @KobeissiLetter with the mission of making complex, data-driven analysis accessible and actionable. I'm glad that is being accomplished. As stated below, "there has never been a market with so much fear yet so much growth." Those who eliminate noise and use objective, data-driven analysis win the most in times like these. US stock market futures open in 10 hours. If you have't yet, read our take below.
https://x.com/i/article/2123757028350791680
 Article · x.com-$6 Trillion In 45 Days: Is This A "Bubble" Or An Opportunity?Our most common question right now: Is there an "AI bubble" and did it pop? US stocks have now lost an average of -$225 billion per day, for 31-straight trading days. Below, we provide a comprehensive
- Post

China's economic slowdown is deepening: China's retail sales rose just +0.4% YoY in October, the 3rd-lowest reading since December 2022, and well below the expected +0.8% growth. This marks a sharp deceleration from a +1.1% YoY increase in September. Retail sales are now on pace to end the year with their weakest growth since 2020. Meanwhile, industrial production grew +4.8% YoY last month, down from +5.5% in September, and the slowest expansion in 3 months. Furthermore, fixed-asset investment fell -8.1% YoY in the first 10 months of 2026, its biggest decline since the 2020 pandemic. In October alone, investment dropped -16.9% YoY, the largest decline on record outside the pandemic. China's domestic demand continues to deteriorate.

- Post
BREAKING: AI-related investment contributed +1.27 percentage points to real US GDP growth in Q1 through Q3 2026. This represents ~65% of the economy's cumulative growth of ~2% over this period. Software investment contributed the most, at +0.45 percentage points, followed by computers and peripheral equipment, at +0.37 percentage points. Communication and electrical equipment contributed +0.21 percentage points, R&D +0.16 percentage points, and data center structures +0.07 percentage points. AI investment has become the backbone of the US economy.

- Post
Anthropic is sitting on an enormous cash pile: Anthropic's cash and cash equivalents are up to a record $237 billion following its IPO. This comes as its IPO raised $81 billion, with another $26 billion secured through a private placement with selected investors. By comparison, Alphabet, $GOOGL, Amazon, $AMZN, SpaceX, $SPCX, and Apple, $AAPL, each hold less than 25% of this amount. Anthropic's cash pile is therefore larger than those 4 companies combined. This is also 8 times Nvidia's, $NVDA, cash balance, 12 times Microsoft's, $MSFT, and 22 times Meta's, $META. For perspective, Berkshire Hathaway’s cash pile stands at $377 billion. Anthropic has a huge amount of cash to deploy.

- Post
What's happening with sentiment? It's hard to remember a time with as much negativity as we are seeing now. The world is in its biggest technological revolution in history, yet so many people want it to fail. Why? AI has the potential to create a world of unprecedented abundance, and this should be a time for optimism. Instead of focusing on the opportunities ahead, the conversation is dominated by fear, skepticism, and predictions of collapse. Once again, the comments on this post will prove our point exactly. Every major technological revolution in history has been met with skepticism, but progress has continued regardless. The opportunities being created right now are generational. Don't let short-term market sentiment blind you to long-term opportunity.
- RepostThe Kobeissi Letter reposted

In case you’re unsure where this market is headed it’s STRONGLY suggested to read this article. Major pivots & structured shifts are coming in the next couple of days…
https://x.com/i/article/2123757028350791680
Article · x.com-$6 Trillion In 45 Days: Is This A "Bubble" Or An Opportunity?Our most common question right now: Is there an "AI bubble" and did it pop? US stocks have now lost an average of -$225 billion per day, for 31-straight trading days. Below, we provide a comprehensive - Post

US semiconductor stocks are experiencing incredible volatility: The Semiconductor Index to S&P 500 ratio is down to 1.45 points, its lowest since April 2026. This ratio has declined -0.46 points, or -24%, from its mid-June peak. Over this period, SOX has fallen -24%, while the S&P 500 has gained +2%. The relative decline is comparable to the one seen following the 2000 Dot-Com Bubble burst. However, the ratio is still up +142% since the 2022 bear market low of, has also declined for 8 consecutive trading sessions, its longest streak since the 2008 Financial Crisis. Semiconductor stocks are more volatile than ever.

- Post
BREAKING: Taiwan announces new restrictions on short selling after its stock market falls -18% in one week, its worst weekly decline in 35 years. Effective Monday, regulators will ban short sales below the previous closing price and raise margin requirements to 150%. Taiwan’s $15 billion stock stabilization fund has also been buying shares to support the market. Authorities are intervening to contain selling pressure.
- Post
BREAKING: Foreign holdings of US Treasuries fell -$76 billion in September, to $9.24 trillion, the lowest since October 2025. This also marks the 3rd monthly decline over the last 4 months, down -$246 billion since February. Japan, the largest foreign holder, cut its holdings by -$5 billion in September, to $1.06 trillion, its lowest since December 2024. The UK, the 2nd-largest holder, reduced its holdings by -$9 billion, to $986 billion, its 3rd-highest on record. At the same time, China, the 3rd-largest holder, slashed its holdings by -$27 billion, to $564 billion, its lowest since July 2008. Foreign demand for US Treasuries is weakening.

- Post
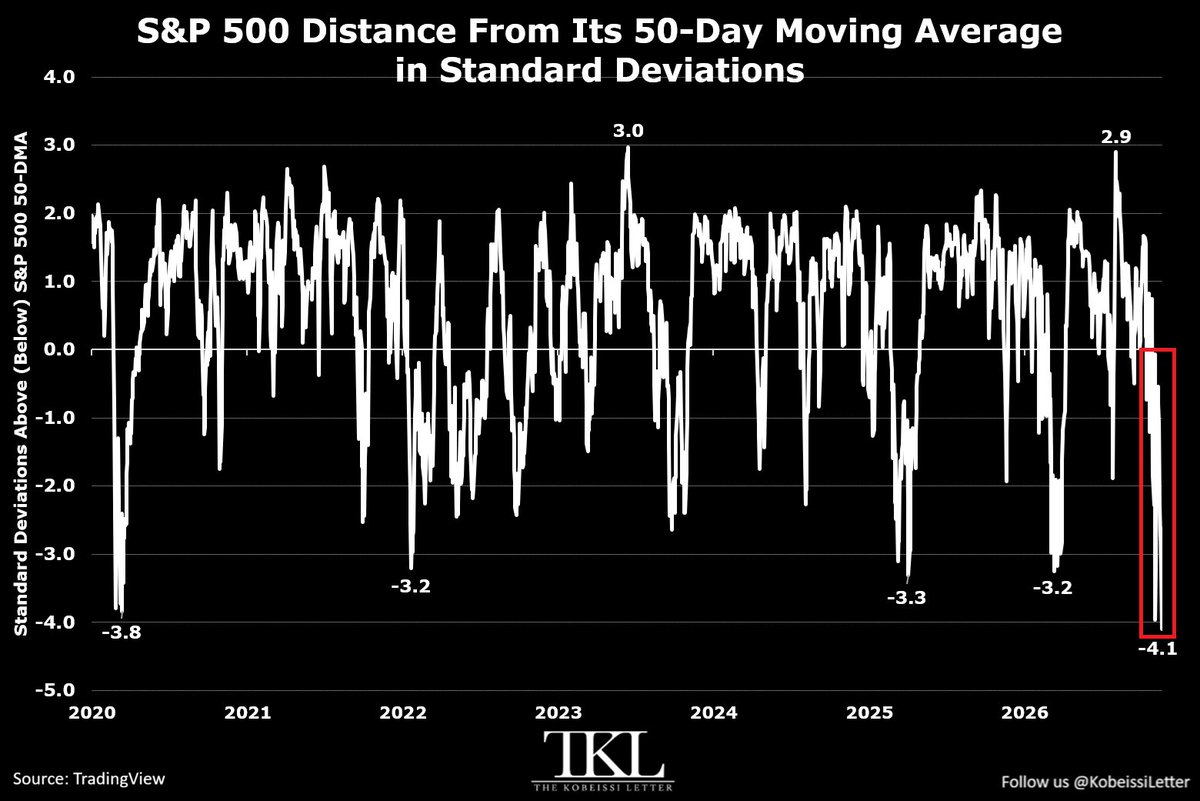
US stocks have rarely been this oversold: The S&P 500 closed the week 4.1 standard deviations below its 50-day moving average, its widest deviation since August 2015. This also marks its 3rd-largest deviation in at least 20 years. By comparison, during the 2008 Financial Crisis, the index’s largest deviation from its 50-DMA was 3.6 standard deviations. Not even the 2020 Pandemic crash saw such extreme oversold conditions, with the S&P 500 falling 3.8 standard deviations below its 50-day moving average in February. During the 2022 bear market and the April 2025 post-"Liberation Day" selloff, the S&P 500 fell 3.2 and 3.3 standard deviations below its 50-day moving average, respectively. This has been one of the sharpest market sell-offs in history.
- RepostThe Kobeissi Letter reposted
- Post
Market sentiment has taken a complete 180 degree turn: The Fear & Greed Index fell to 9.7 points on Friday, below 10.0 for the first time since March 2026. This marks its 4th lowest level since the 2022 bear market. A reading below 30.0 indicates "Extreme Fear" territory and oversold market conditions. The index has fallen -30.6 points, or -76%, over the last 6 trading sessions, its sharpest decline since February 2025. The last 3 times the Fear & Greed Index fell below 10.0, the S&P 500 rallied +10.5% on average over the next 3 weeks. Since 2021, the S&P 500 has gained +9.0% on average over the 3 weeks following readings below 10.0. Sentiment is extremely polarized right now.

- Post
BREAKING: Crypto markets saw $2.7 billion worth of levered positions liquidated in 24 hours amid last night's drop in Bitcoin to its lowest level since September 2024. This officially marks the 11th-largest liquidation event in crypto market history. Since the October 2025 high, crypto markets have lost -$2.3 trillion in market cap.

- Reply
There has never been a market with so much fear yet so much growth. Stay tuned for an update to this Article as price action progresses. Follow us @KobeissiLetter for real-time analysis as this develops.
- Reply
There has never been a market with so much fear yet so much growth. In our view, the market’s polarity yields the most opportunity. Stay tuned for an update to this Article as price action progresses. Follow us @KobeissiLetter for real-time analysis as this develops.
- Post
Inflation in Japan is accelerating: Japan's CPI inflation excluding fresh food jumped +2.1% YoY in September, its highest YoY increase since December 2025. Since May, Japan's CPI inflation has risen +0.6 percentage points. Furthermore, CPI excluding fresh food and energy surged +2.4% YoY, its largest YoY increase since January. Overall CPI inflation rose +2.1% YoY last month, its highest reading since November 2025. This comes as the Iran War continues to fuel inflationary pressures in Japan, which relies heavily on imported food and energy. Meanwhile, Japan's major food and beverage companies planned price increases for 3,153 items in October, the 2nd consecutive monthly reading above 3,000 for the first time since July 2023. Inflationary pressures in Japan are broadening again.

- Post
BREAKING: The US Economic Surprise Index is up to 71 points, its 2nd-highest reading since August 2023. This metric compares actual economic data with market expectations, rising above 0 when data beats estimates and falling below 0 when data misses expectations. Excluding July and August 2023, this is the highest reading since the rapid economic recovery following the 2020 Pandemic. Since August, the index has surged +56 points, or +373%. Over the last 23 years, the index has exceeded its current level only 5% of the time. The US economy is gaining momentum.

- Post
Commodity inflation is set to drop sharply after this month: Prices of WTI Crude oil, Gasoline, Brent oil, and Heating oil are down -21.7%, -21.4%, -19.8%, and -15.3%, respectively, so far in November. This is followed by copper, silver, and sugar prices, which are down -14.1%, -13.0%, and -11.0%. Platinum, Aluminum, and Palladium are down -9.0%, -7.1%, and -7.1%, respectively. Meanwhile, gold prices are down -7.6% so far this month, to their lowest level since September 2025. Wheat and coffee prices are down -4.2% and -4.1%, respectively. Commodities are under historic pressure.

- Quote
BREAKING: This past week's -10.4% drop in the Nasdaq 100 was one of the rarest weekly declines in 40 years. Of the last 2,133 trading weeks, just 11 saw declines of this magnitude or worse. That's 0.52% of all weeks, a 3.27 standard deviation move based on the historical mean and volatility. Of course, market returns exhibit "fat tails," meaning extreme moves occur more frequently than a normal distribution would predict. However, even accounting for the fact that extreme market moves are more common than traditional statistical models suggest, this was a historically rare selloff. Volatility returns when markets least expect it.

https://x.com/i/article/2123757028350791680
Article · x.com-$6 Trillion In 45 Days: Is This A "Bubble" Or An Opportunity?Our most common question right now: Is there an "AI bubble" and did it pop? US stocks have now lost an average of -$225 billion per day, for 31-straight trading days. Below, we provide a comprehensive breakdown of how we got here, what is happening, and what we see next.
Since November 2022, we have been highly bullish on AI, calling it the biggest technological revolution in history. Our view of "own assets or be left behind" was built on the combination of innovation-driven returns and compou - RepostThe Kobeissi Letter reposted
The sentiment-induced liquidity crunch we saw in stocks and gold today is spreading to crypto tonight. Crypto has now seen $2.3 billion in levered positions liquidated in 24 hours, the 13th largest liquidation event in history. All crypto gains since President Trump won the 2024 Election are gone, a total of -$2.3 trillion. Liquidity crunches like these are when 24/7 markets can be dangerous. As outlined in our Article below, liquidity must be restored for markets to bottom.

https://x.com/i/article/2123757028350791680
Article · x.com-$6 Trillion In 45 Days: Is This A "Bubble" Or An Opportunity?Our most common question right now: Is there an "AI bubble" and did it pop? US stocks have now lost an average of -$225 billion per day, for 31-straight trading days. Below, we provide a comprehensive - Post
- RepostThe Kobeissi Letter reposted

Do yourself a favor. If you’re unsure what to do next, read this article over the weekend to prepare for next week.
https://x.com/i/article/2123757028350791680
Article · x.com-$6 Trillion In 45 Days: Is This A "Bubble" Or An Opportunity?Our most common question right now: Is there an "AI bubble" and did it pop? US stocks have now lost an average of -$225 billion per day, for 31-straight trading days. Below, we provide a comprehensive - Post
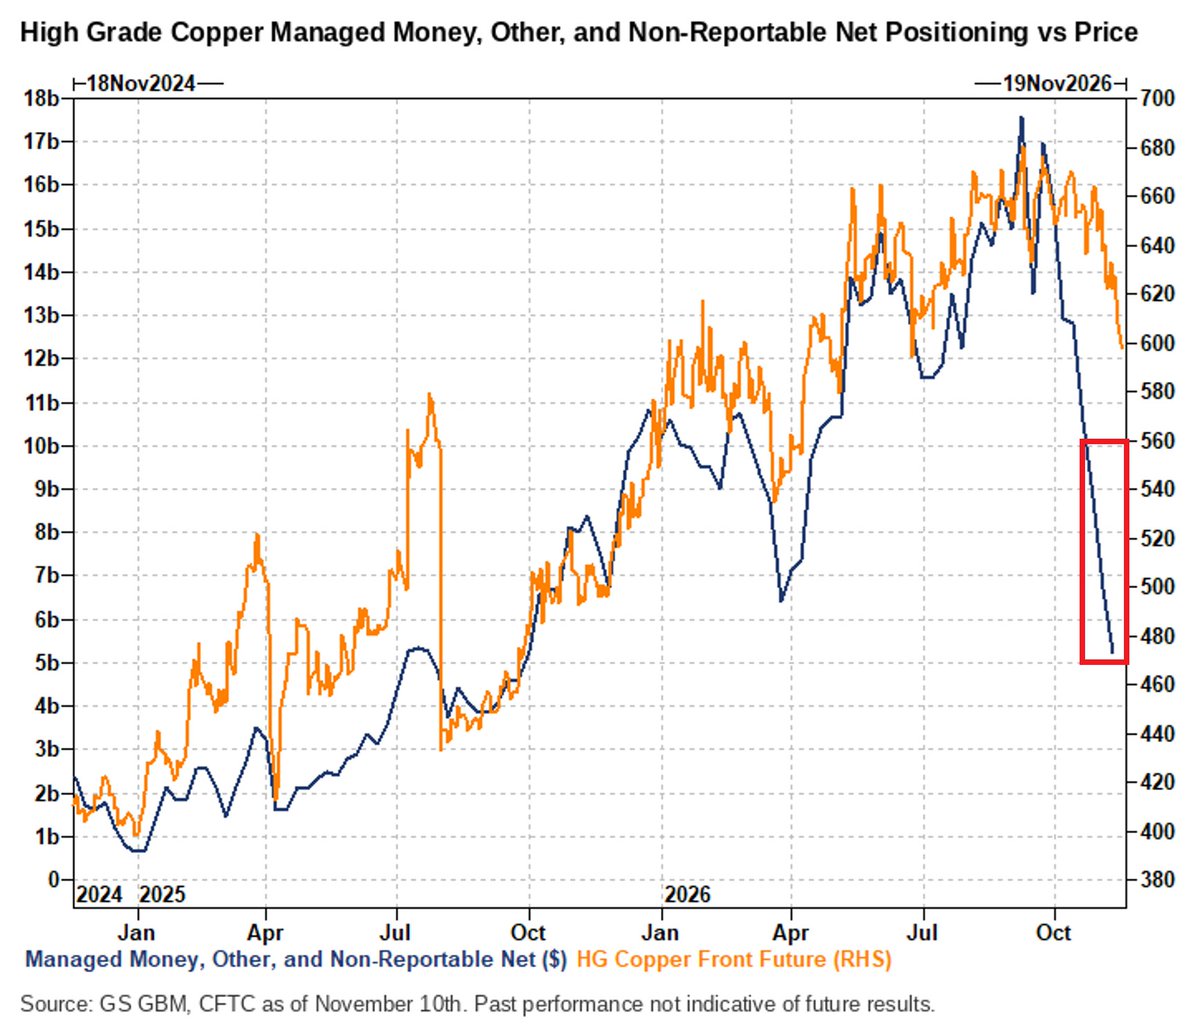
Investor positioning in copper is cratering: Speculative investors sold -$1.3 billion in Comex copper futures in the week ending November 10th, marking the 7th consecutive weekly sale. This group includes hedge funds, commodity trading advisers (CTAs), and other institutional investors. Since September 22nd, they have sold a cumulative -$10.8 billion. This brings long speculative investor positioning down to ~$5.2 billion, its lowest since October 2025. Meanwhile, copper futures fell -5.3% on Wednesday, marking their largest daily decline since July 2026. Copper prices are now down -18.2% from their September peak, to $5.67 per pound, their lowest level since April. The copper market is seeing a massive shift in sentiment.
- Post
The semiconductor trade is still popular among fund managers: 39% of global fund managers said "long global semiconductors" was the most crowded trade, according to a BofA survey of 169 fund managers overseeing $461 billion in assets conducted between November 6th and November 12th. This marks the 6th consecutive month that semiconductors have held the top spot. However, this figure is down from the 82% peak recorded in July this year. Meanwhile, “Short China Stocks” ranked 2nd for the first time, with 14% of respondents identifying it as the most crowded trade. By comparison, "Long Magnificent 7" and "Short Treasuries" were considered the most crowded trades just by 12% and 10% of fund managers, respectively. Investor appetite for semiconductor stocks remains strong.

- Post
BREAKING: The 3-month correlation between the S&P 500 and gold is up to +0.35, doubling since February. The correlation between these two assets has remained positive throughout the year, unlike in 2025, when it was negative for most months. Since the Iran War began, gold has increasingly traded like a risky asset rather than a hedge against market declines, moving alongside equities. Year-to-date, gold prices are now down -17%, on track for their biggest annual decline since 2013. This comes as elevated energy prices, resurging inflation, and rising interest rates have heavily weighed on gold. Furthermore, recent equity market losses have forced some investors to liquidate gold holdings to offset losses elsewhere. Gold is caught up in the liquidity crunch.





About this tracker
This page follows The Kobeissi Letter (@KobeissiLetter) on X, one of the accounts on TweetStream's live board of posts that move markets, in its Fed and economy group. New posts are listed newest first with their catch speed: the time from the post's own timestamp to TweetStream's first receipt. TweetStream catches X posts in typically 166 ms.
The count includes what shows on the account's main feed: main posts, quote posts, reposts, and replies that continue its own thread. Other replies are left out. Polymarket's weekly post-count rules describe the same kinds of post, but this is not their settlement figure: each market settles on the tracker its rules name. "Today" runs from midnight New York time. "Usual by now" is the average over the previous 7 days, scaled to the share of today that has passed, and the pace label says whether today is above or below it. A post deleted after TweetStream caught it stays in the count. Posts appear here at least 60 seconds after TweetStream receives them.
More in Fed and economy: Federal Reserve, Nick Timiraos, Scott Bessent, Treasury Department, Bureau of Labor Statistics, zerohedge.