Updated 0s ago · Free board, delayed at least 60 s
Bureau of Labor Statistics @BLS_gov on X
Bureau of Labor Statistics has posted 0 times so far today, Sunday, November 22 (New York time), against a usual 1 by this hour.
- Today
- 0
- Usual by now
- 1
- Last 7 days
- 25
- Daily average
- 3.6
Below usual
Latest posts
- Post

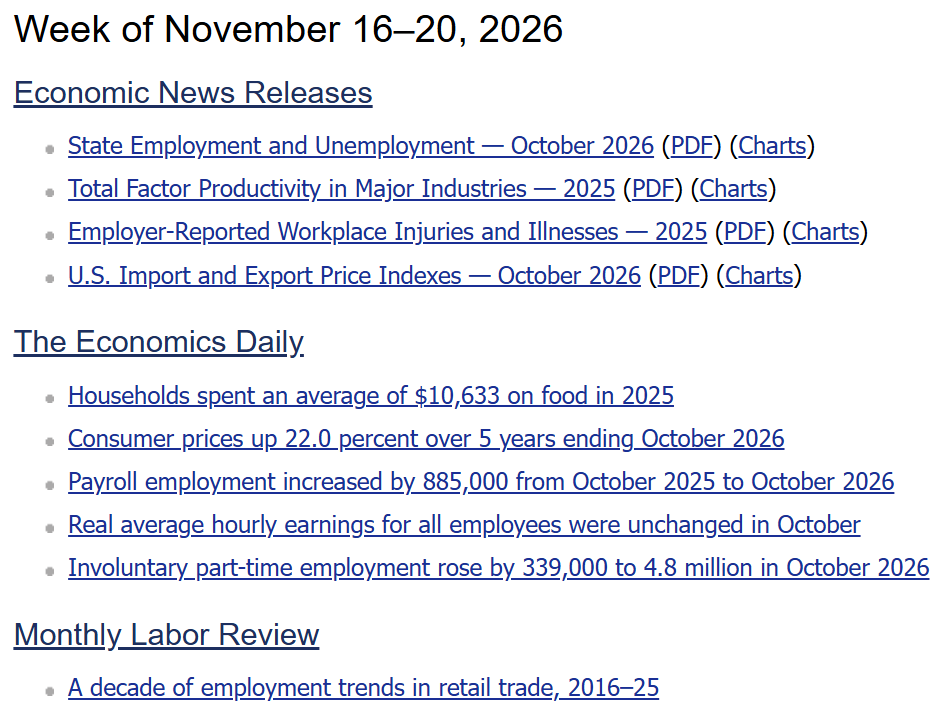
Catch up on all the new #BLSdata and publications that came out this week! https://www.bls.gov/opub/update.htm
- Reply
Employers report 2.4 million injury and illness cases in 2025, down 3.0% from 2024 #BLSData https://www.bls.gov/news.release/archives/osh_11182026.htm
- Reply
Employers report 2.4 million injury and illness cases in 2025, down 3.0% from 2024 #BLSData https://www.bls.gov/news.release/archives/osh_11182026.htm
- Reply
Employers report 2.4 million injury and illness cases in 2025, down 3.0% from 2024 #BLSData https://www.bls.gov/news.release/archives/osh_11182026.htm
- Reply
Employers report 2.4 million injury and illness cases in 2025, down 3.0% from 2024 #BLSData https://www.bls.gov/news.release/archives/osh_11182026.htm
- Reply
Employers report 2.4 million injury and illness cases in 2025, down 3.0% from 2024 #BLSData https://www.bls.gov/news.release/archives/osh_11182026.htm
- Reply
Employers report 2.4 million injury and illness cases in 2025, down 3.0% from 2024 #BLSData https://www.bls.gov/news.release/archives/osh_11182026.htm
- Reply
Employers report 2.4 million injury and illness cases in 2025, down 3.0% from 2024 #BLSData https://www.bls.gov/news.release/archives/osh_11182026.htm
- Post
Households spent an average of $10,633 on food in 2025 #BLSData https://www.bls.gov/opub/ted/2026/households-spent-an-average-of-10633-on-food-in-2025.htm

- Post
Total factor productivity increases in 7 out of 19 major industries in 2025 #BLSData https://www.bls.gov/news.release/archives/prod5_11202026.htm
- Post
October jobless rates down in 3 states, up in 1; payroll jobs up in 4 states #BLSData https://www.bls.gov/news.release/archives/laus_11202026.htm
- Post
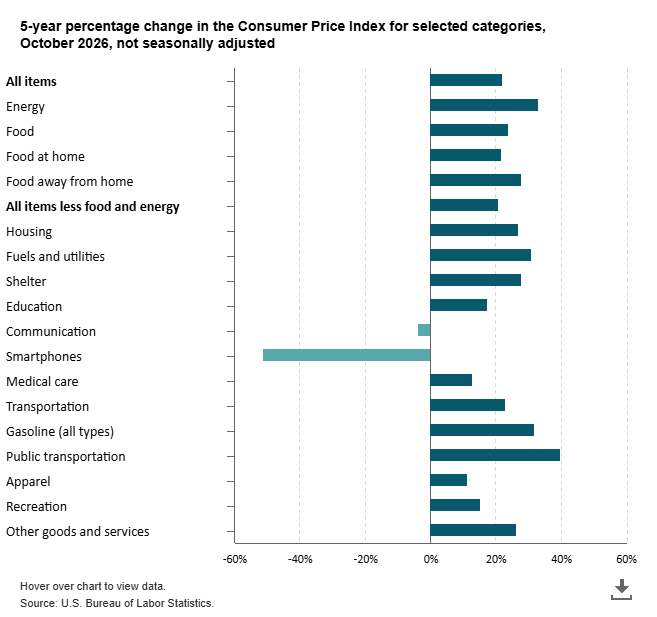
Consumer prices up 22.0 percent over 5 years ending October 2026 #BLSData https://www.bls.gov/opub/ted/2026/consumer-prices-up-22-0-percent-over-5-years-ending-october-2026.htm
- Post
Consumer prices up 22.0 percent over 5 years ending October 2026 #BLSData https://www.bls.gov/opub/ted/2026/consumer-prices-up-22-0-percent-over-5-years-ending-october-2026.htm
- Post
Payroll employment increased by 885,000 from October 2025 to October 2026 #BLSData https://www.bls.gov/opub/ted/2026/payroll-employment-increased-by-885000-from-october-2025-to-october-2026.htm

- Post
Payroll employment increased by 885,000 from October 2025 to October 2026 #BLSData https://www.bls.gov/opub/ted/2026/payroll-employment-increased-by-885000-from-october-2025-to-october-2026.htm

- Post
Employers report 2.4 million injury and illness cases in 2025, down 3.0% from 2024 #BLSData https://www.bls.gov/news.release/archives/osh_11182026.htm
- Post
Real average hourly earnings for all employees were unchanged in October #BLSData https://www.bls.gov/opub/ted/2026/real-average-hourly-earnings-for-all-employees-were-unchanged-in-october.htm

- Reply
A decade of employment trends in retail trade, 2016–25 #BLSData https://www.bls.gov/opub/mlr/2026/article/a-decade-of-employment-trends-in-retail-trade-2016-25.htm

- Post
A decade of employment trends in retail trade, 2016–25 #BLSData https://www.bls.gov/opub/mlr/2026/article/a-decade-of-employment-trends-in-retail-trade-2016-25.htm
- Post
Real average hourly earnings for all employees were unchanged in October #BLSData https://www.bls.gov/opub/ted/2026/real-average-hourly-earnings-for-all-employees-were-unchanged-in-october.htm

- Post
U.S. import prices rise 1.1% in October on higher nonfuel prices; export prices up 1.1% #BLSData https://www.bls.gov/news.release/archives/ximpim_11172026.htm
- Reply
Postpandemic employment recovery by industry sector and selected states #BLSData https://www.bls.gov/opub/mlr/2026/article/postpandemic-employment-recovery-by-industry-sector-and-selected-states.htm

- Post
Postpandemic employment recovery by industry sector and selected states #BLSData https://www.bls.gov/opub/mlr/2026/article/postpandemic-employment-recovery-by-industry-sector-and-selected-states.htm
- Post
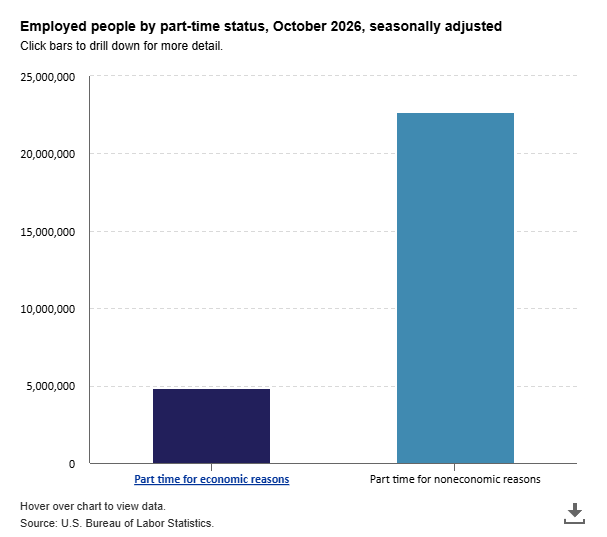
Involuntary part-time employment rose by 339,000 to 4.8 million in October 2026 #BLSData https://www.bls.gov/opub/ted/2026/involuntary-part-time-employment-rose-by-339000-to-4.8-million-in-october-2026.htm
- Post
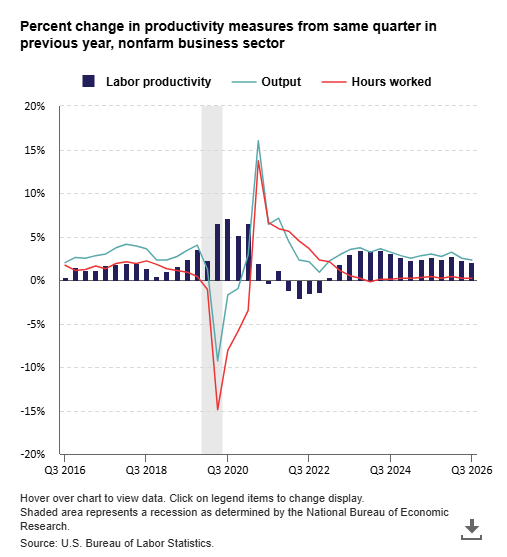
Nonfarm business productivity up 2.1 percent from third quarter 2025 to third quarter 2026 #BLSData https://www.bls.gov/opub/ted/2026/nonfarm-business-productivity-up-2-1-percent-from-third-quarter-2025-to-third-quarter-2026.htm
About this tracker
This page follows Bureau of Labor Statistics (@BLS_gov) on X, one of the accounts on TweetStream's live board of posts that move markets, in its Fed and economy group. New posts are listed newest first with their catch speed: the time from the post's own timestamp to TweetStream's first receipt. TweetStream catches X posts in typically 166 ms.
The count includes what shows on the account's main feed: main posts, quote posts, reposts, and replies that continue its own thread. Other replies are left out. Polymarket's weekly post-count rules describe the same kinds of post, but this is not their settlement figure: each market settles on the tracker its rules name. "Today" runs from midnight New York time. "Usual by now" is the average over the previous 7 days, scaled to the share of today that has passed, and the pace label says whether today is above or below it. A post deleted after TweetStream caught it stays in the count. Posts appear here at least 60 seconds after TweetStream receives them.
More in Fed and economy: Federal Reserve, Nick Timiraos, Scott Bessent, Treasury Department, The Kobeissi Letter, zerohedge.